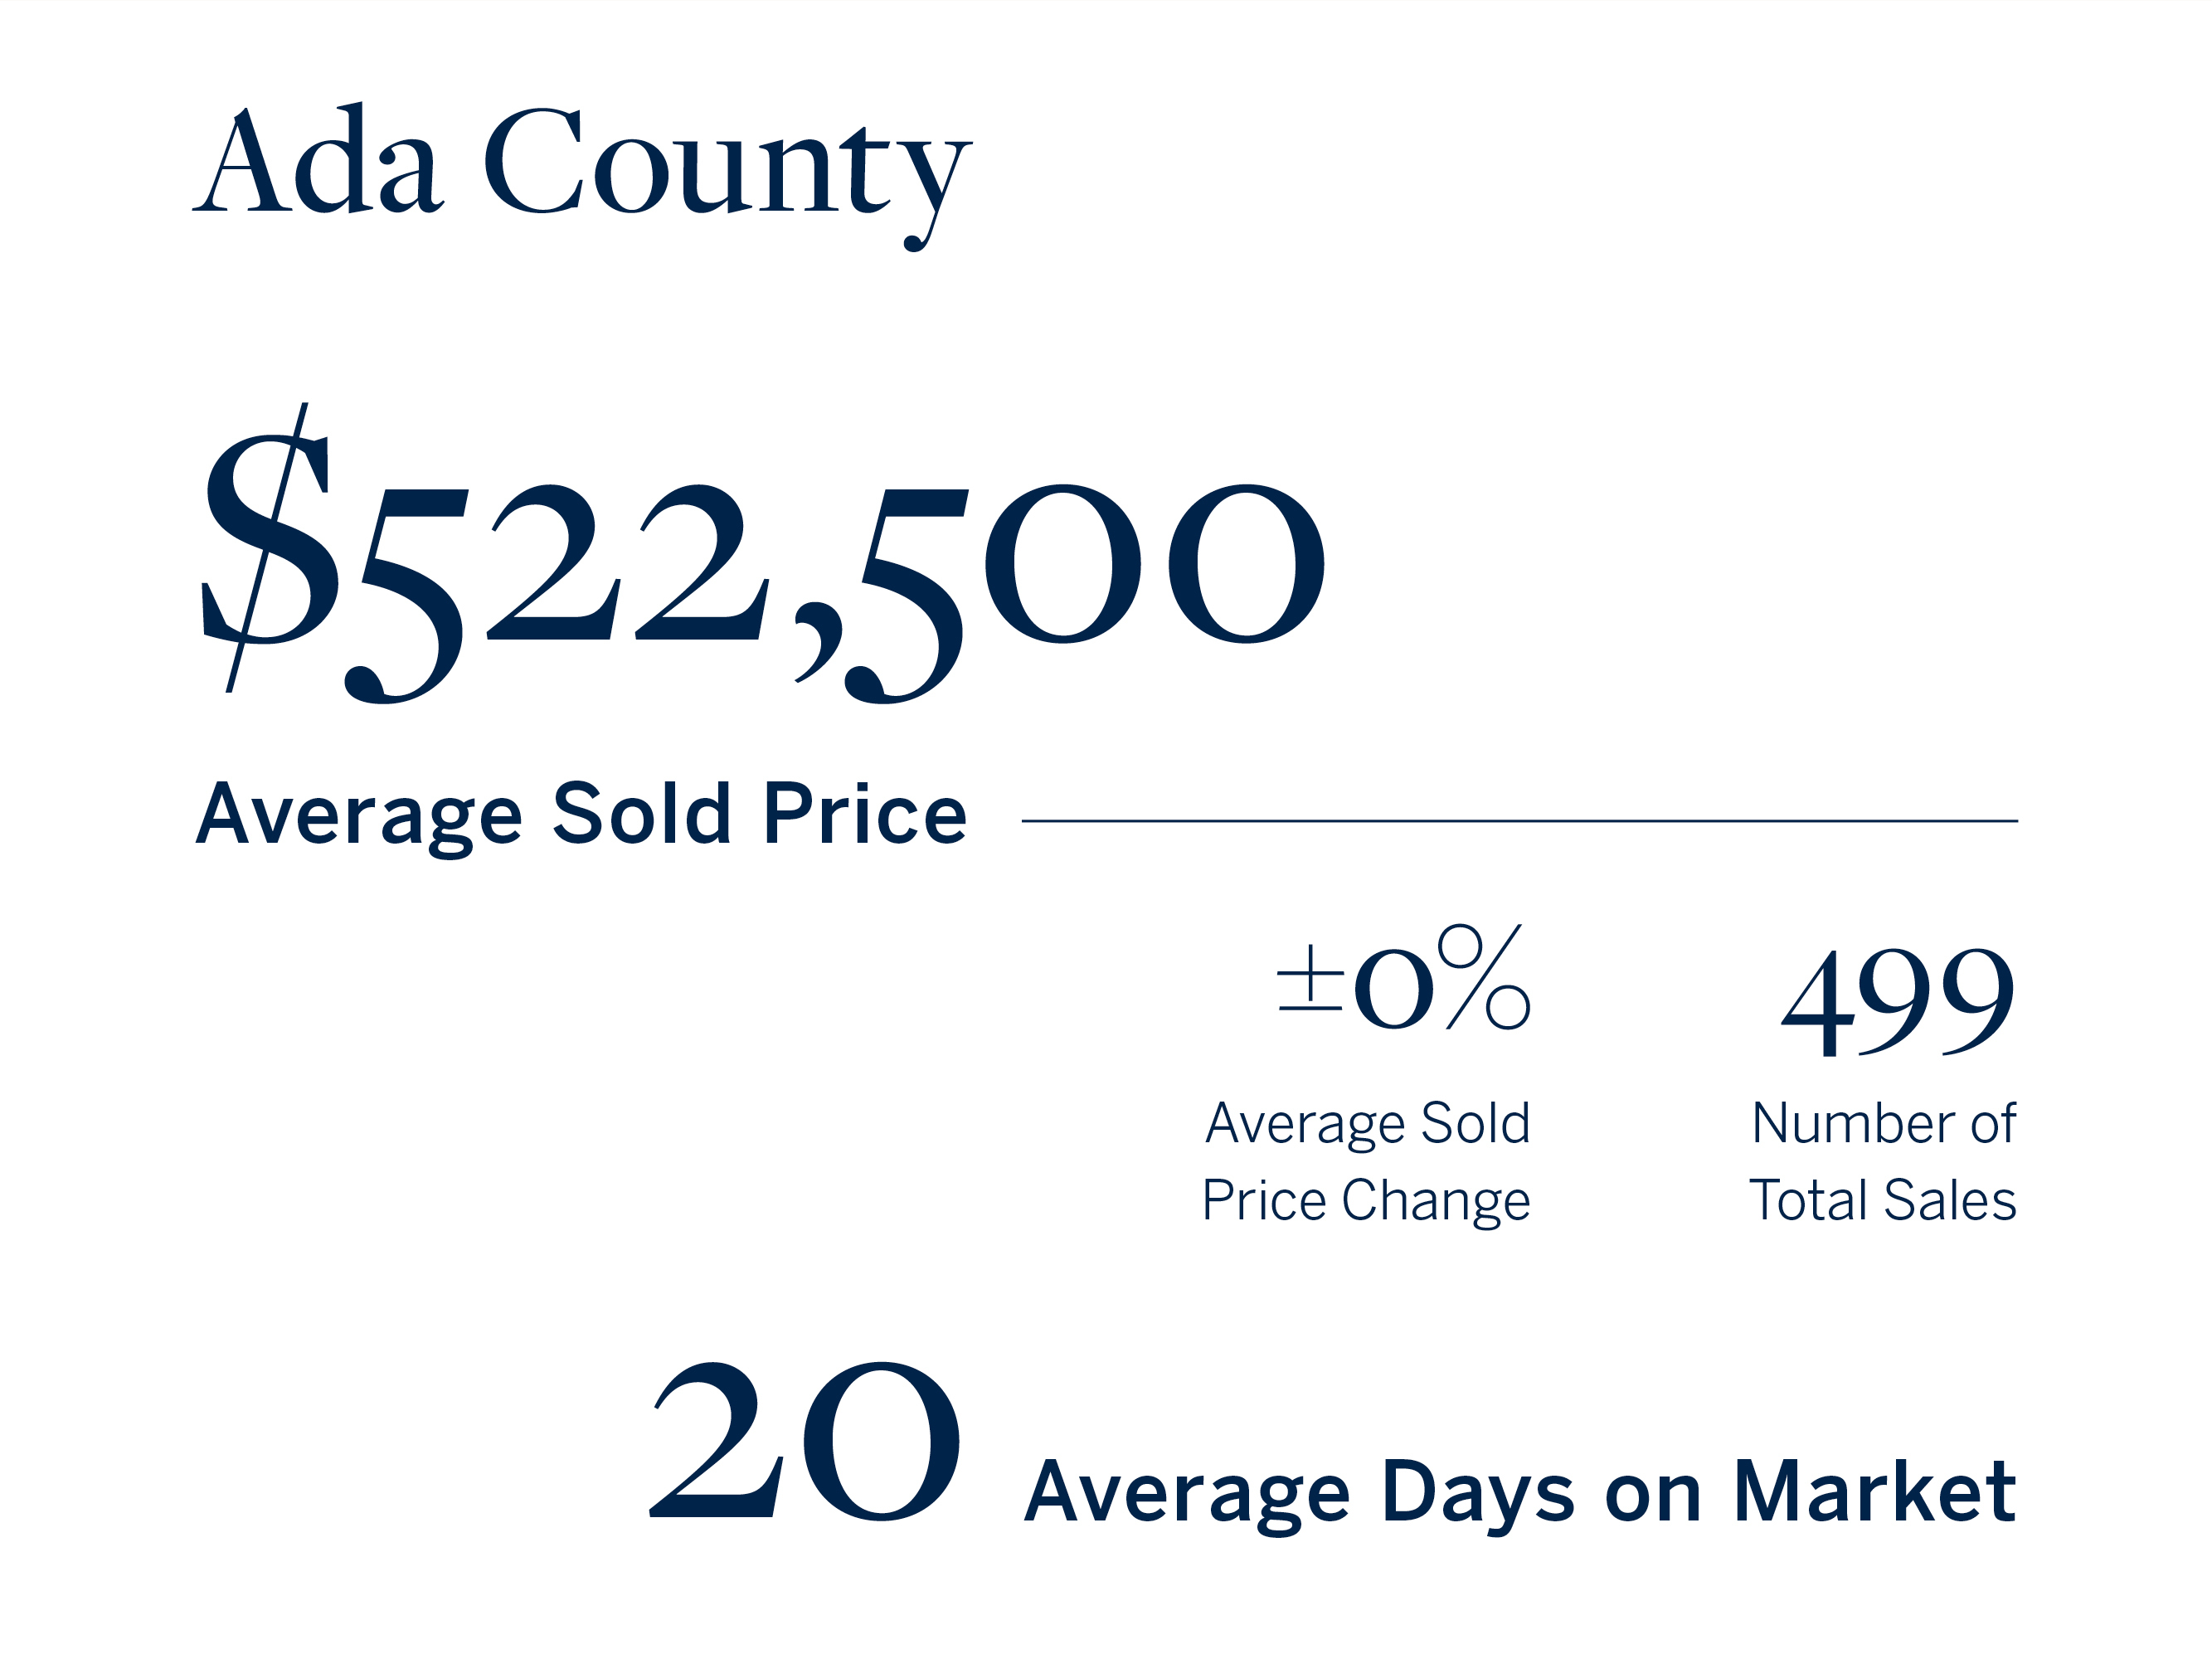
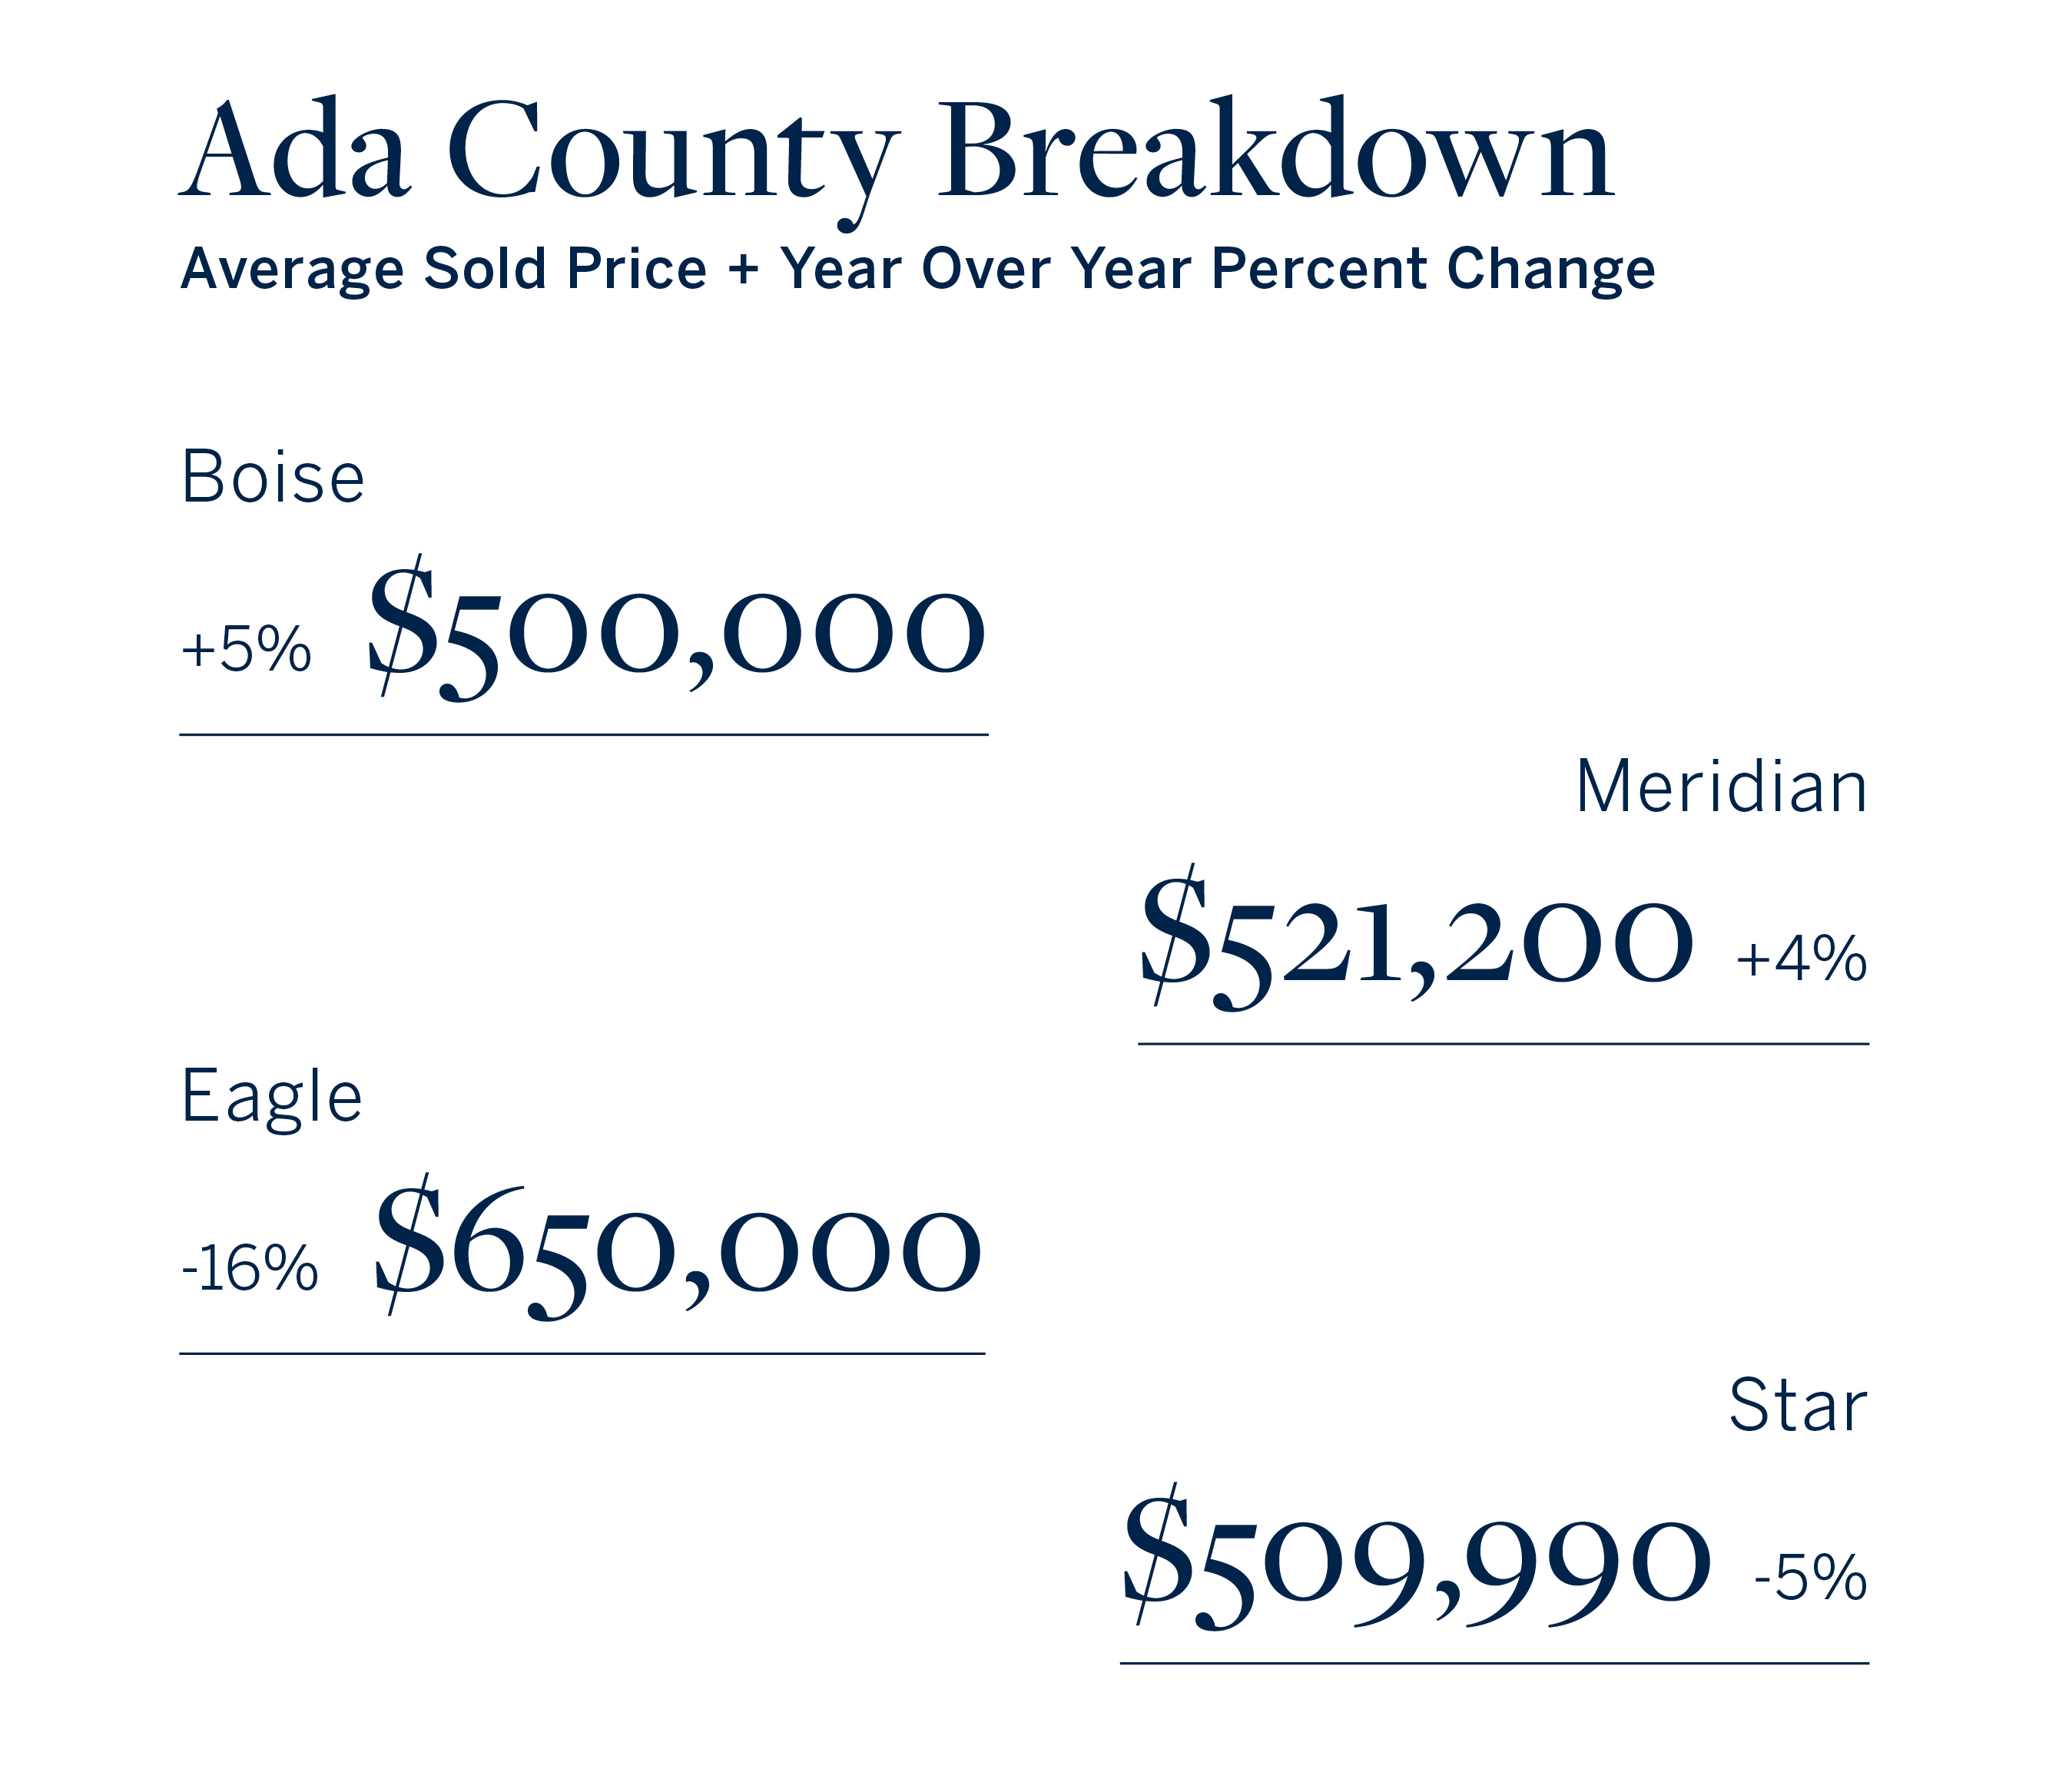
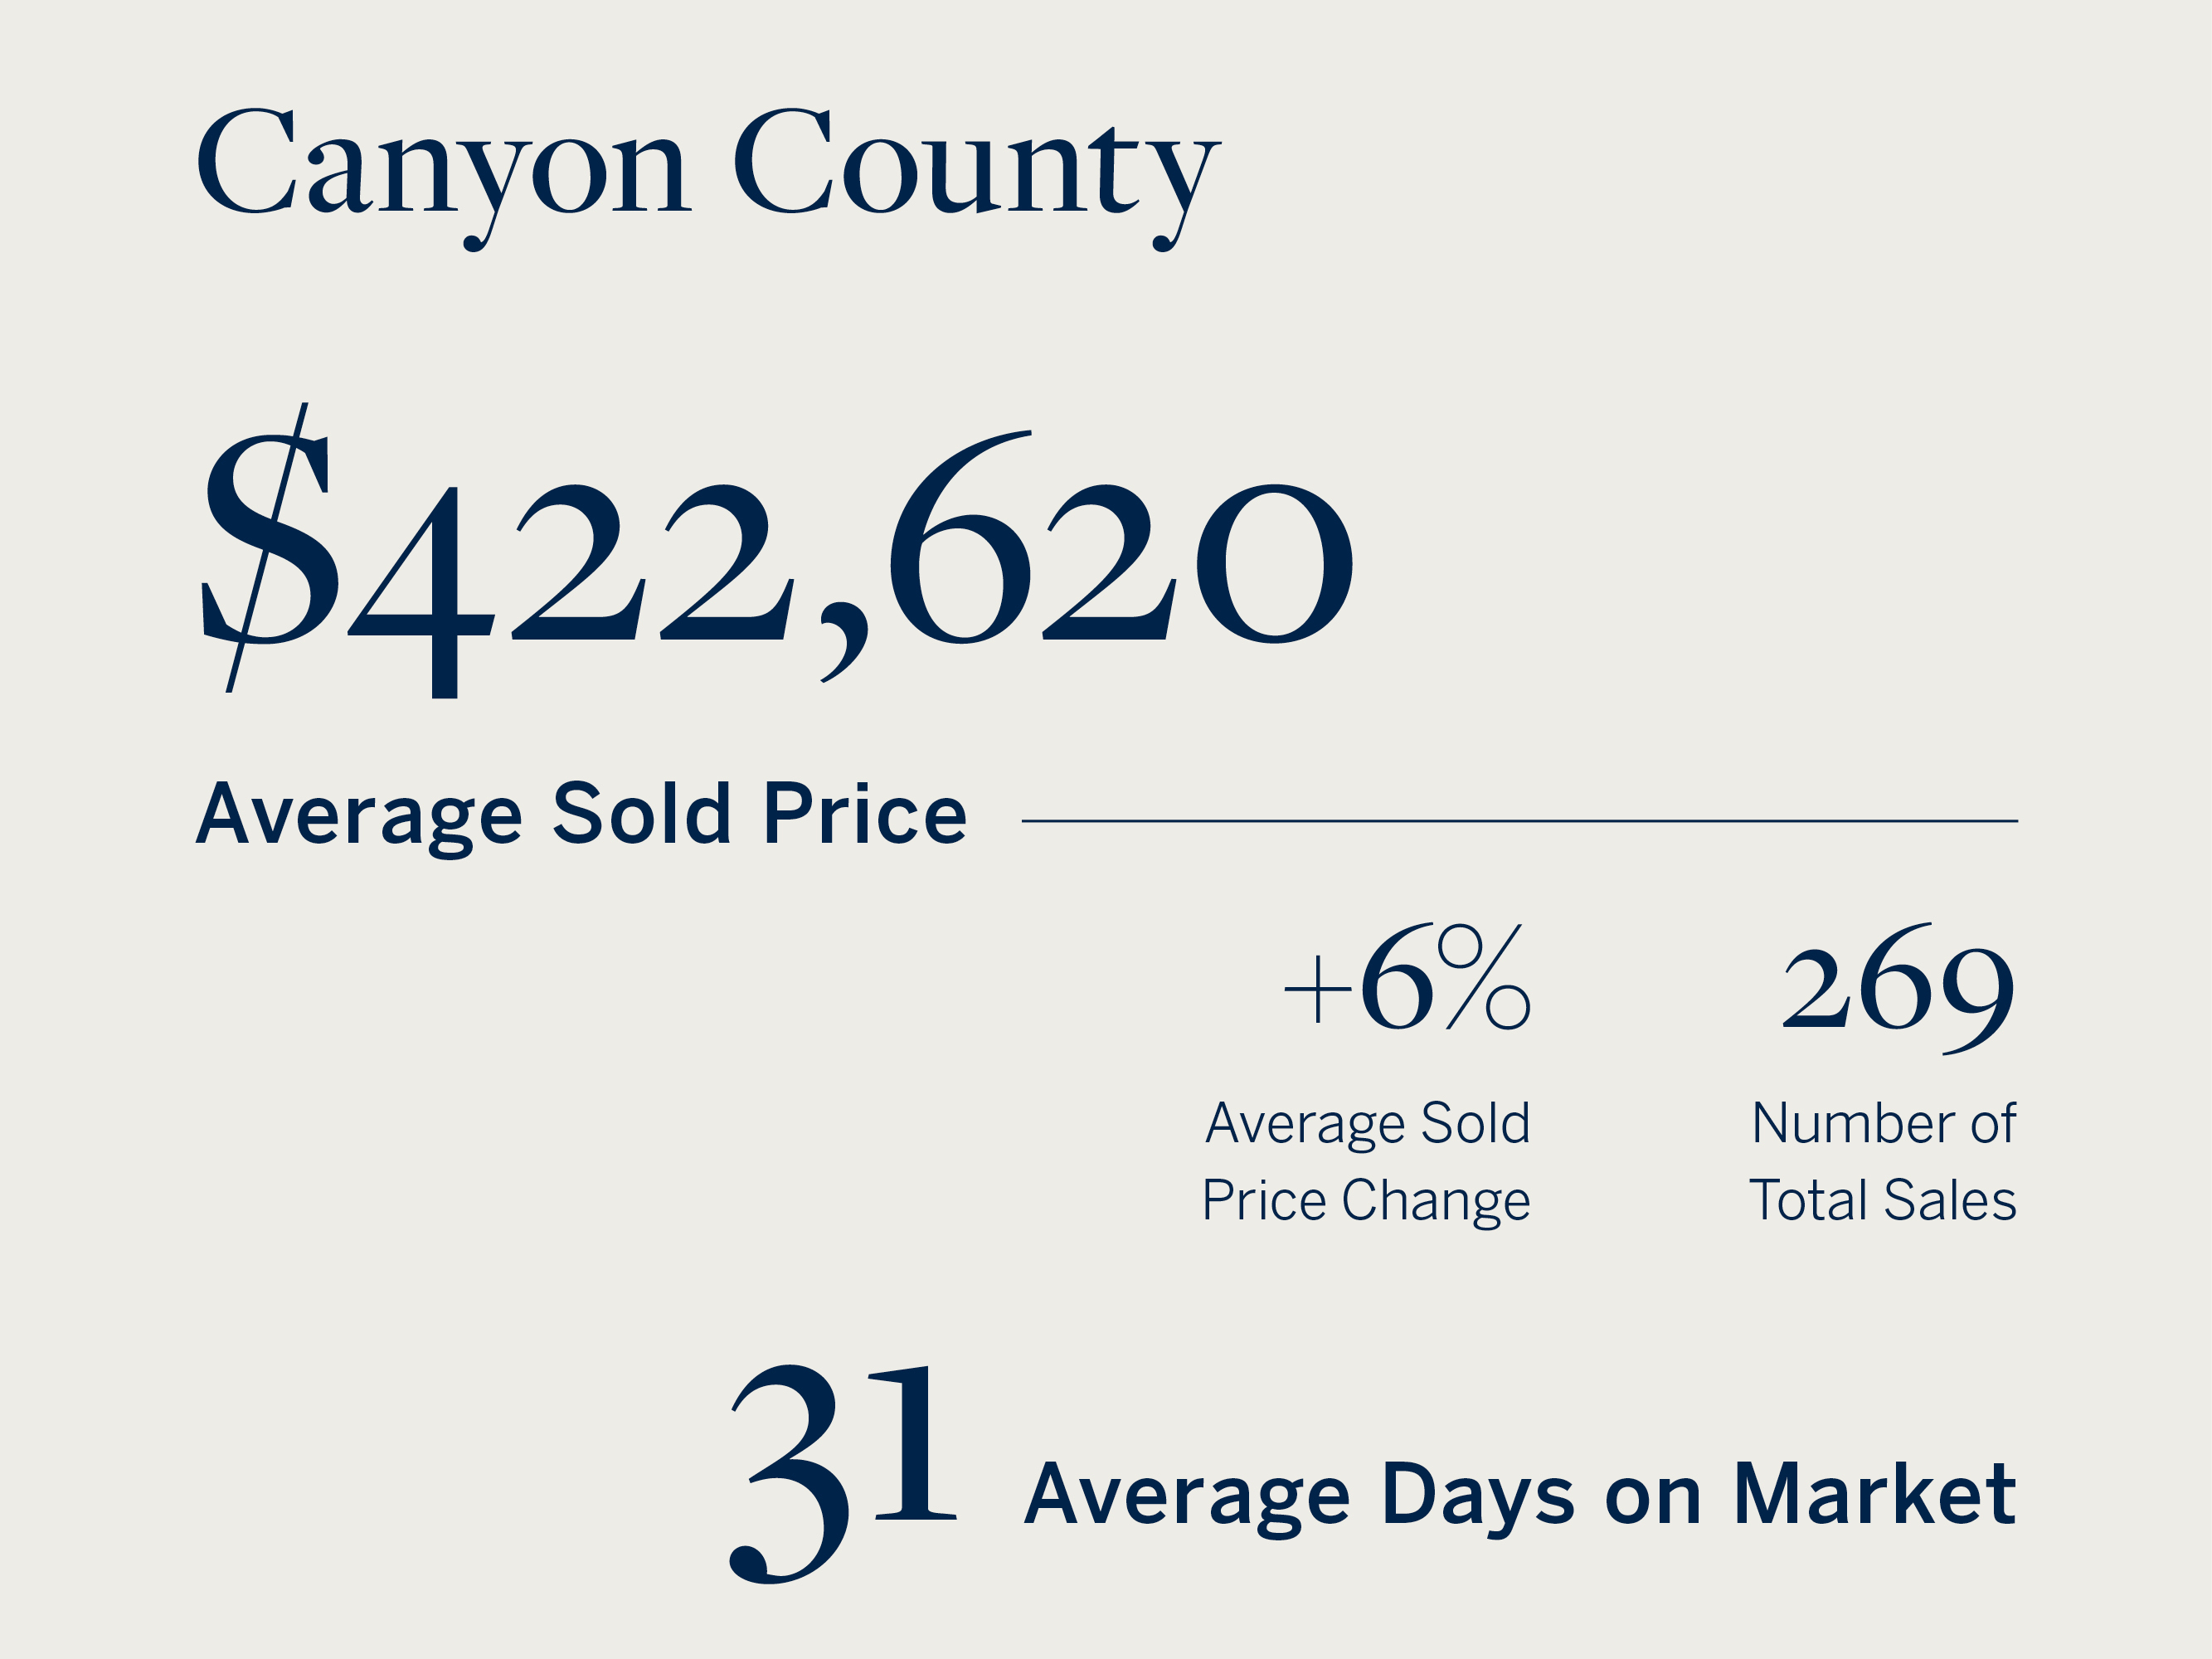
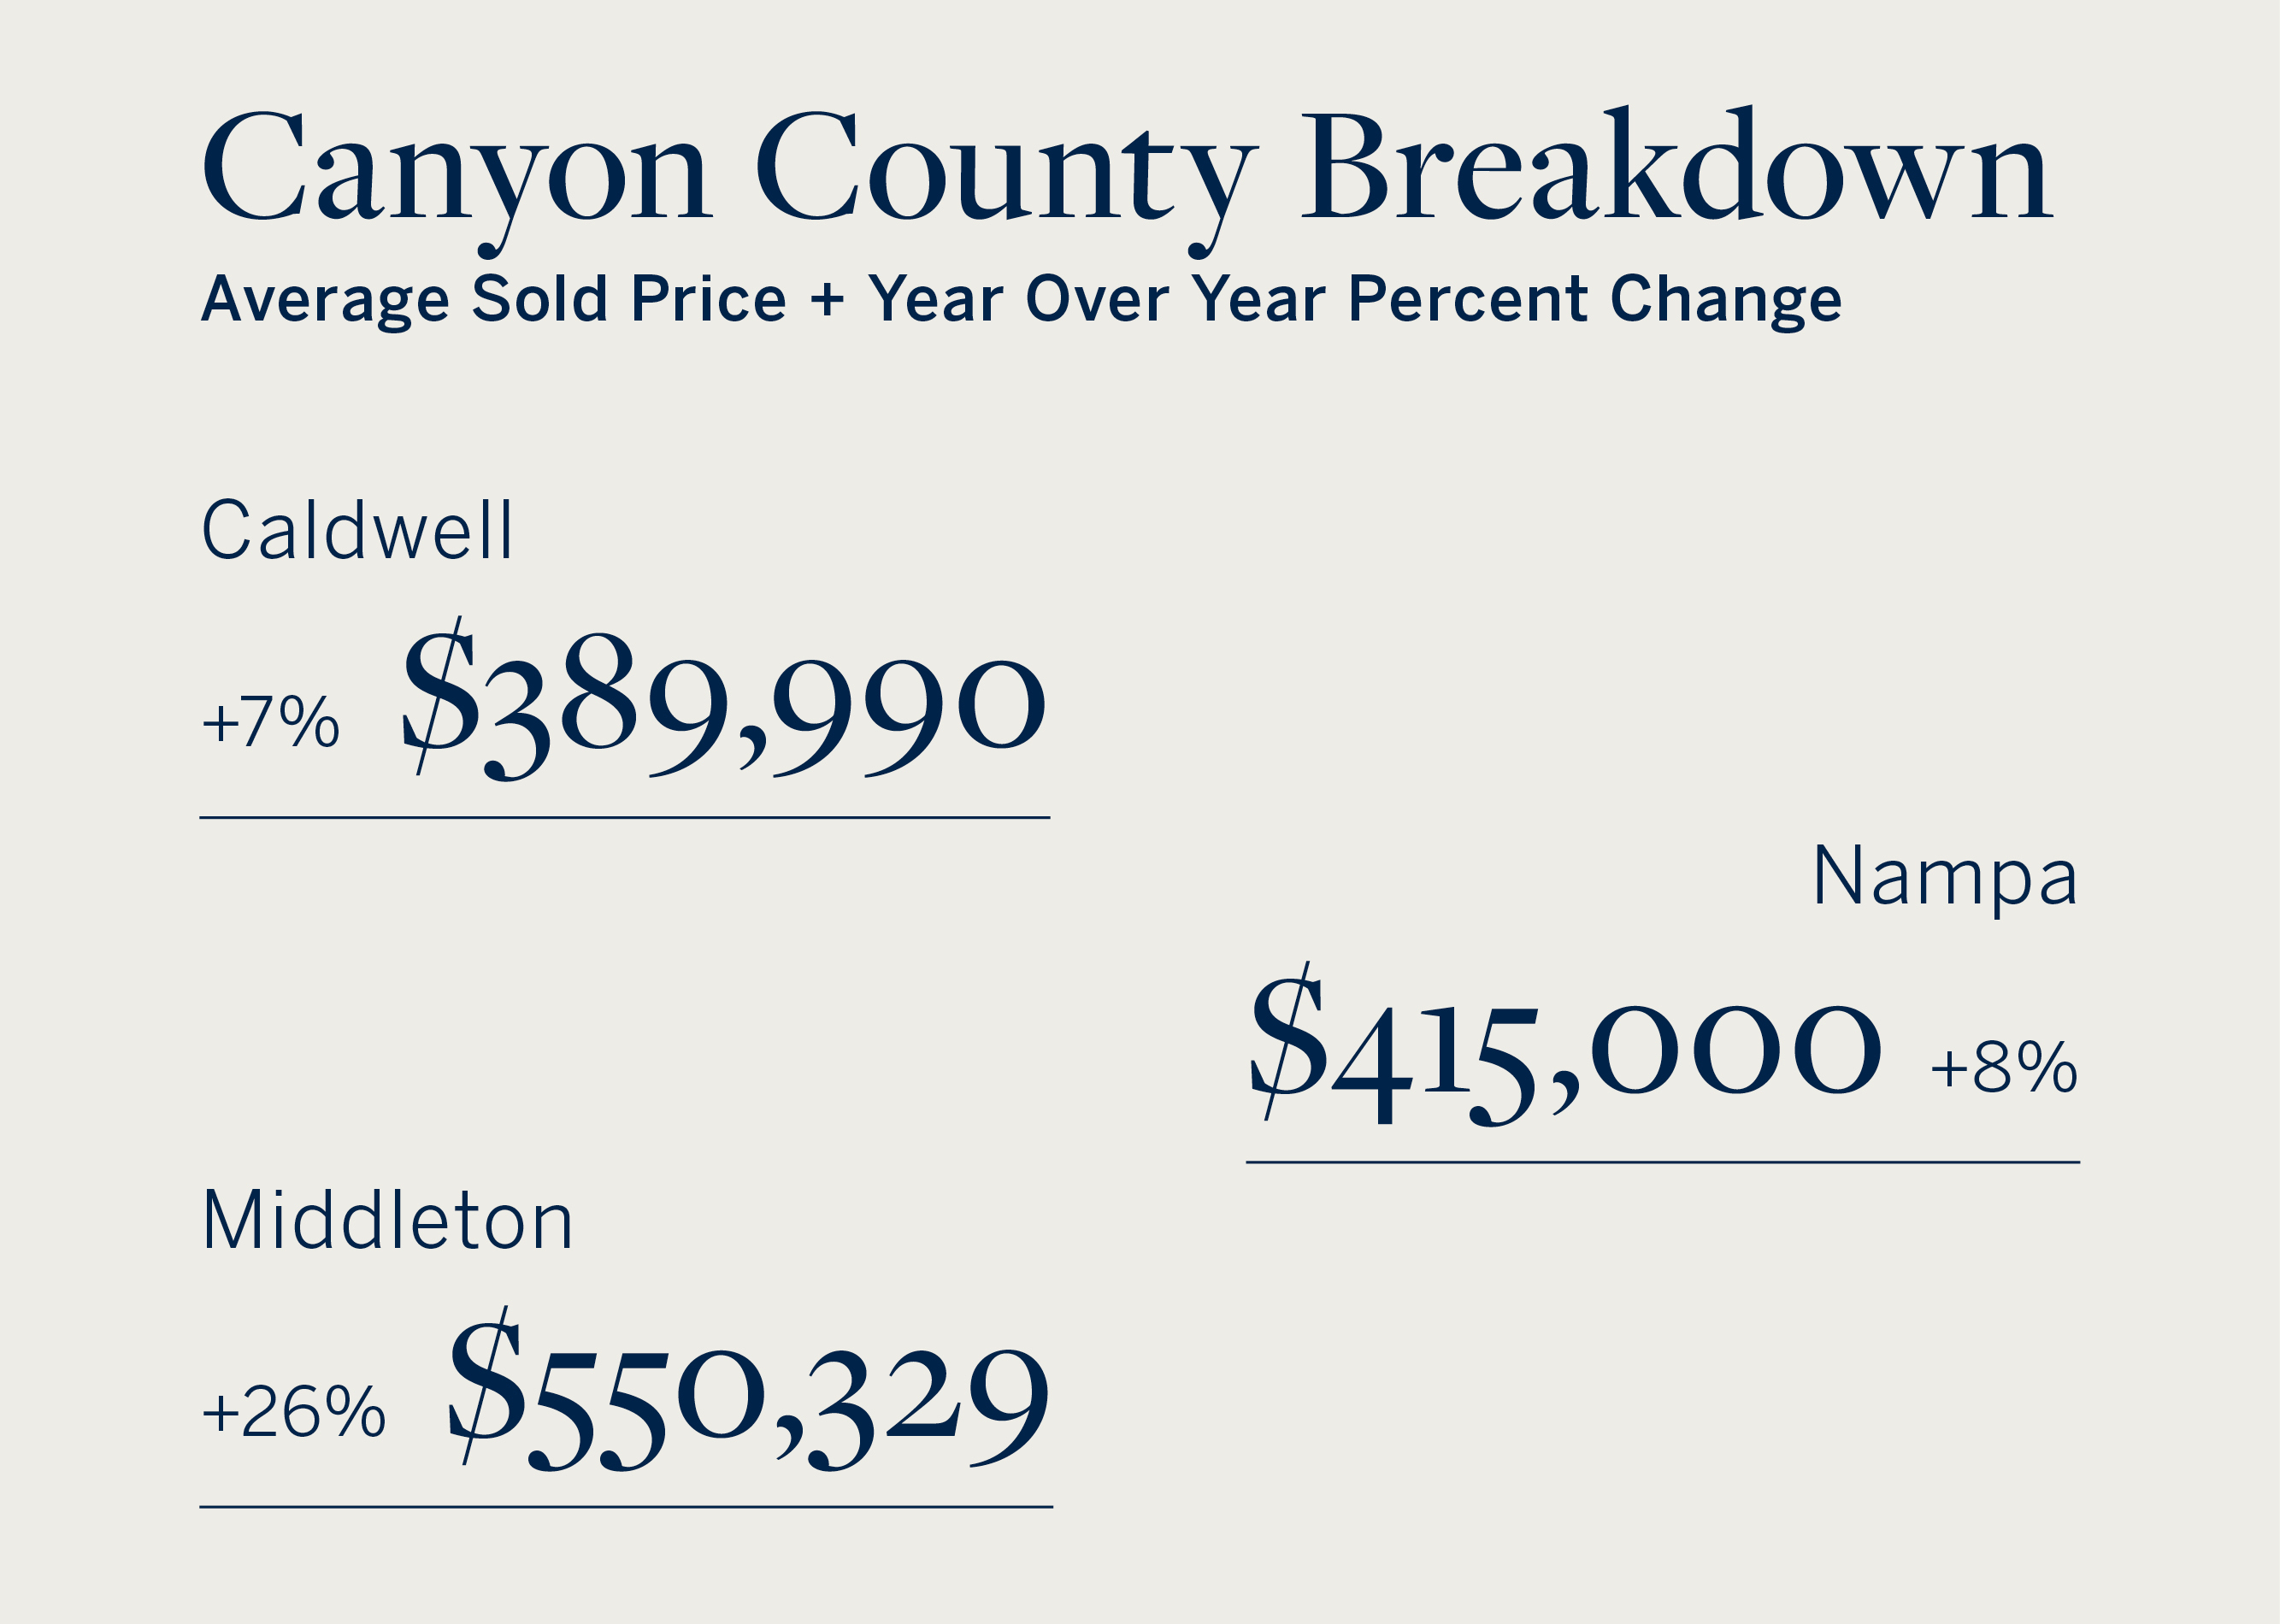
This real estate market report is based on information from sources including Intermountain Multiple Listing Service for the period November 1, 2023 through November 30, 2024. Information not verifiable by Intermountain Multiple Listing Service. Prepared by Group One Sotheby’s International Realty.
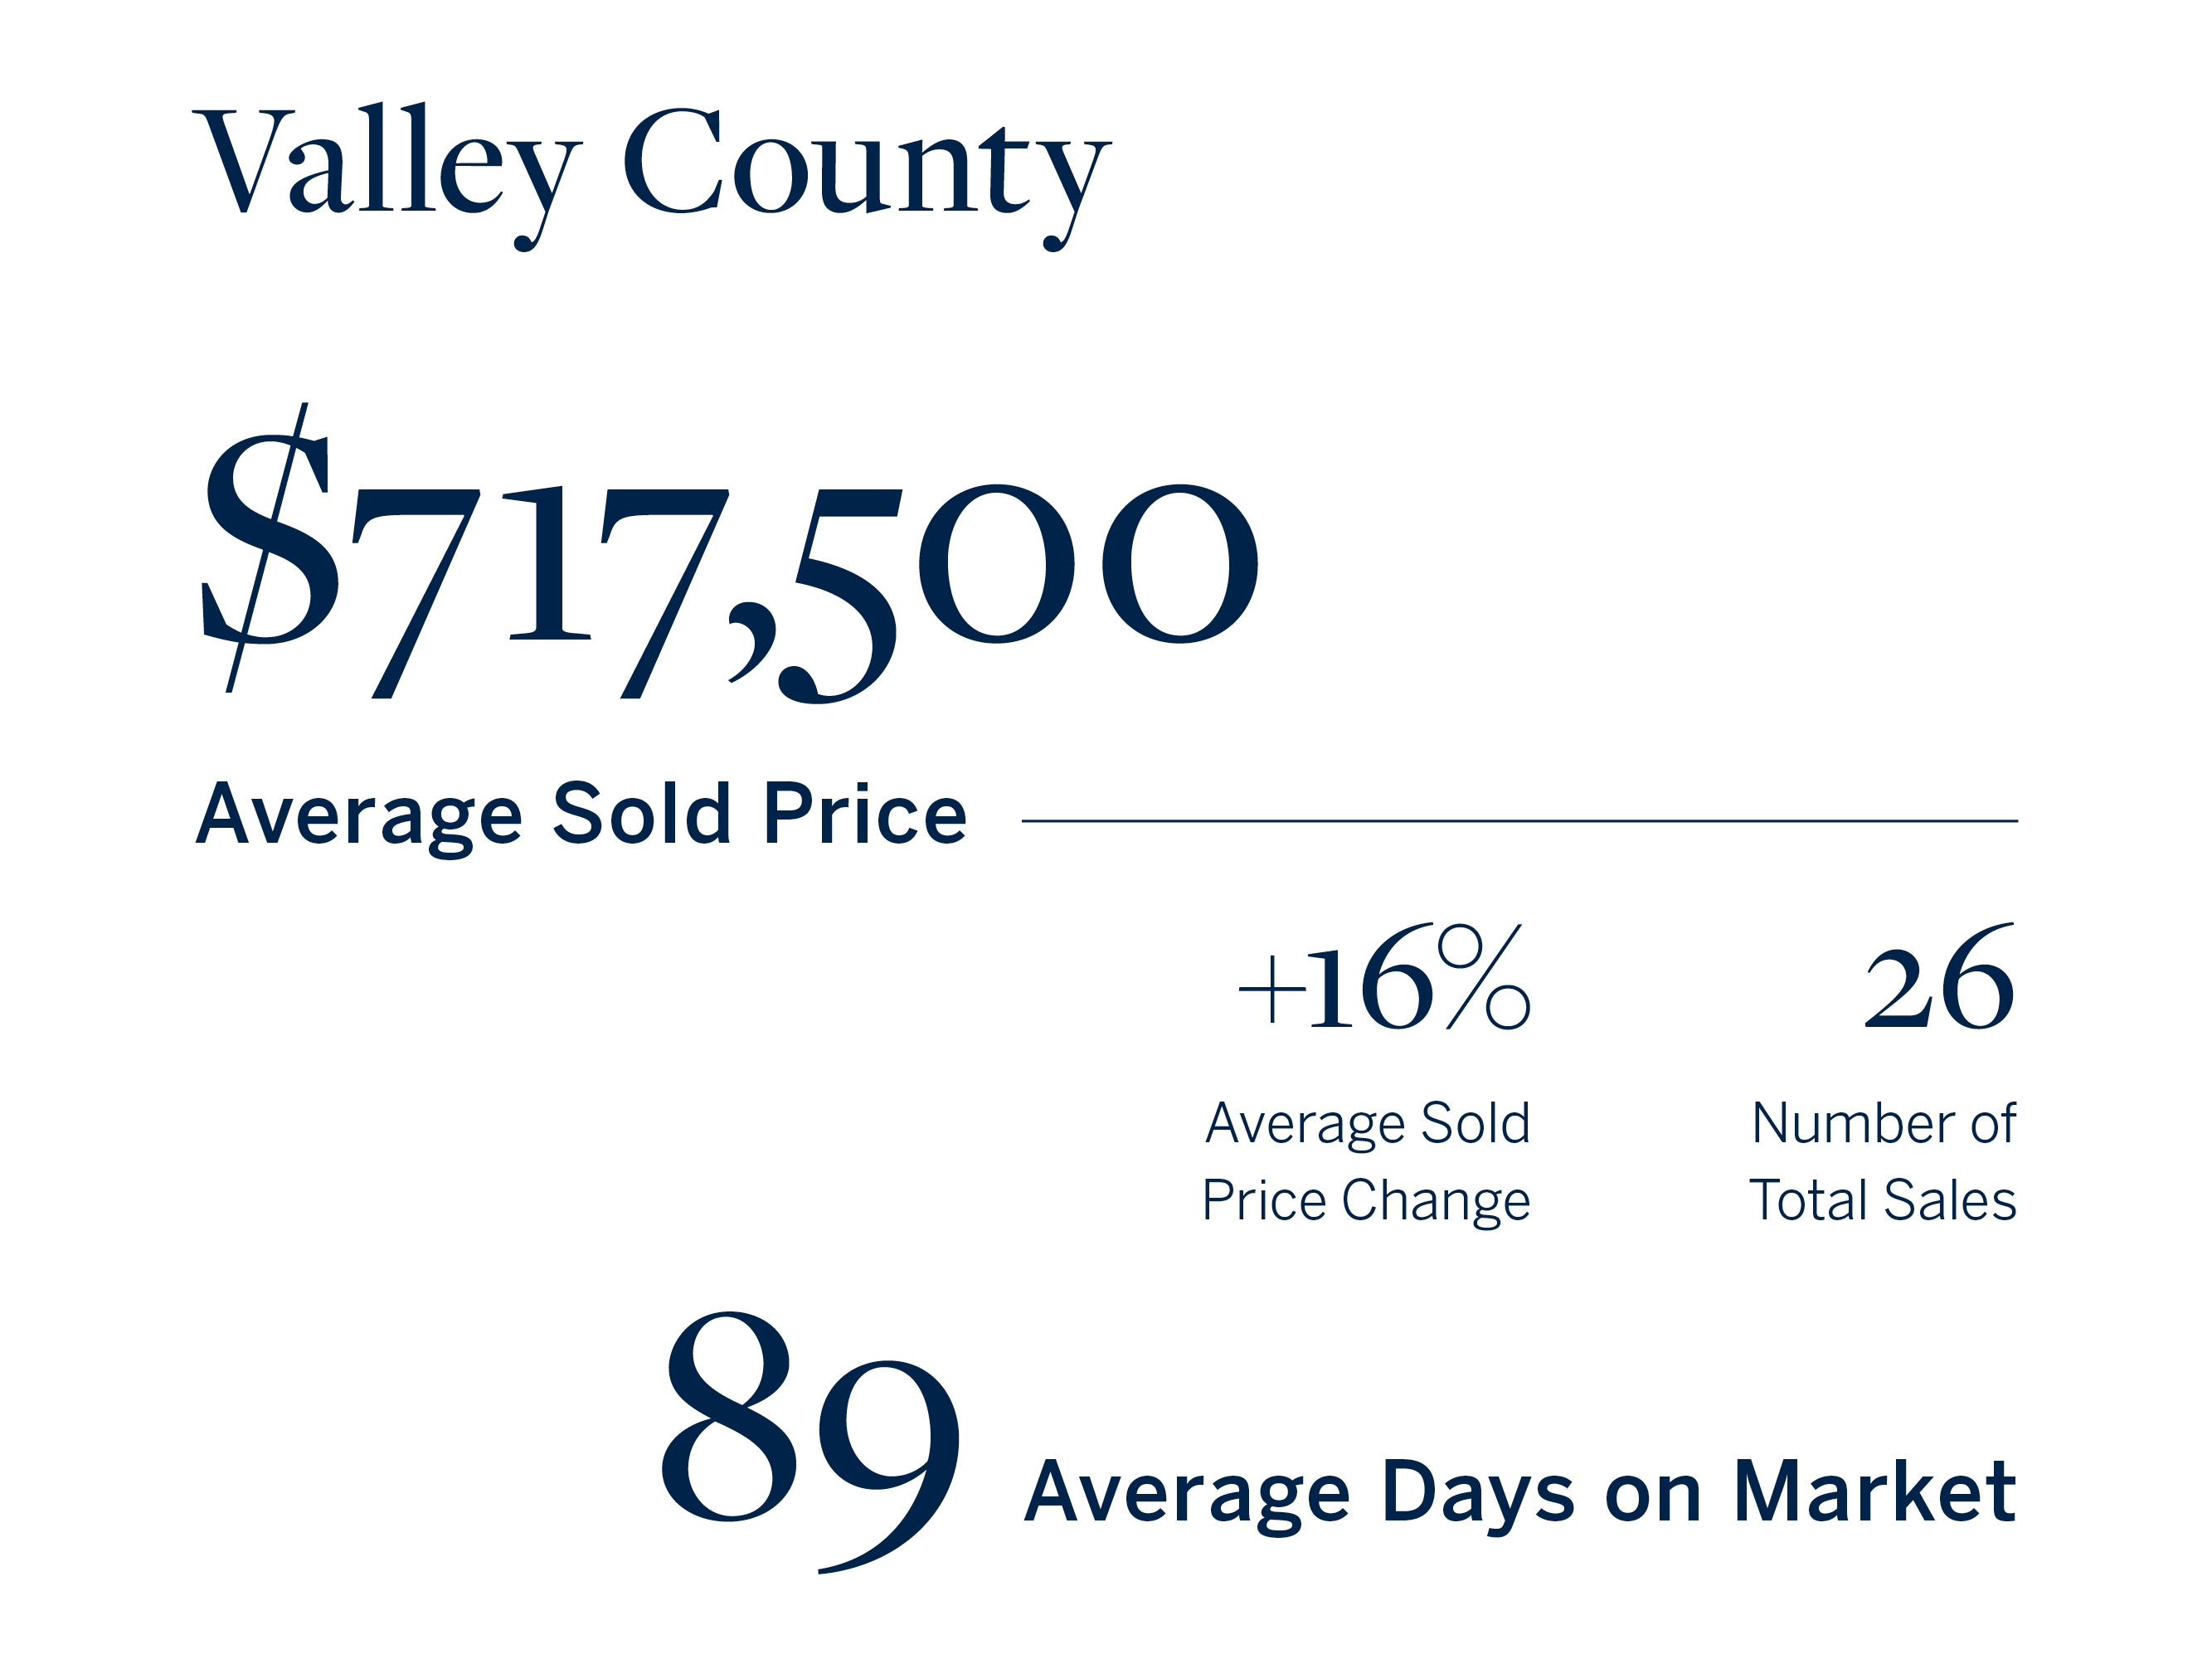
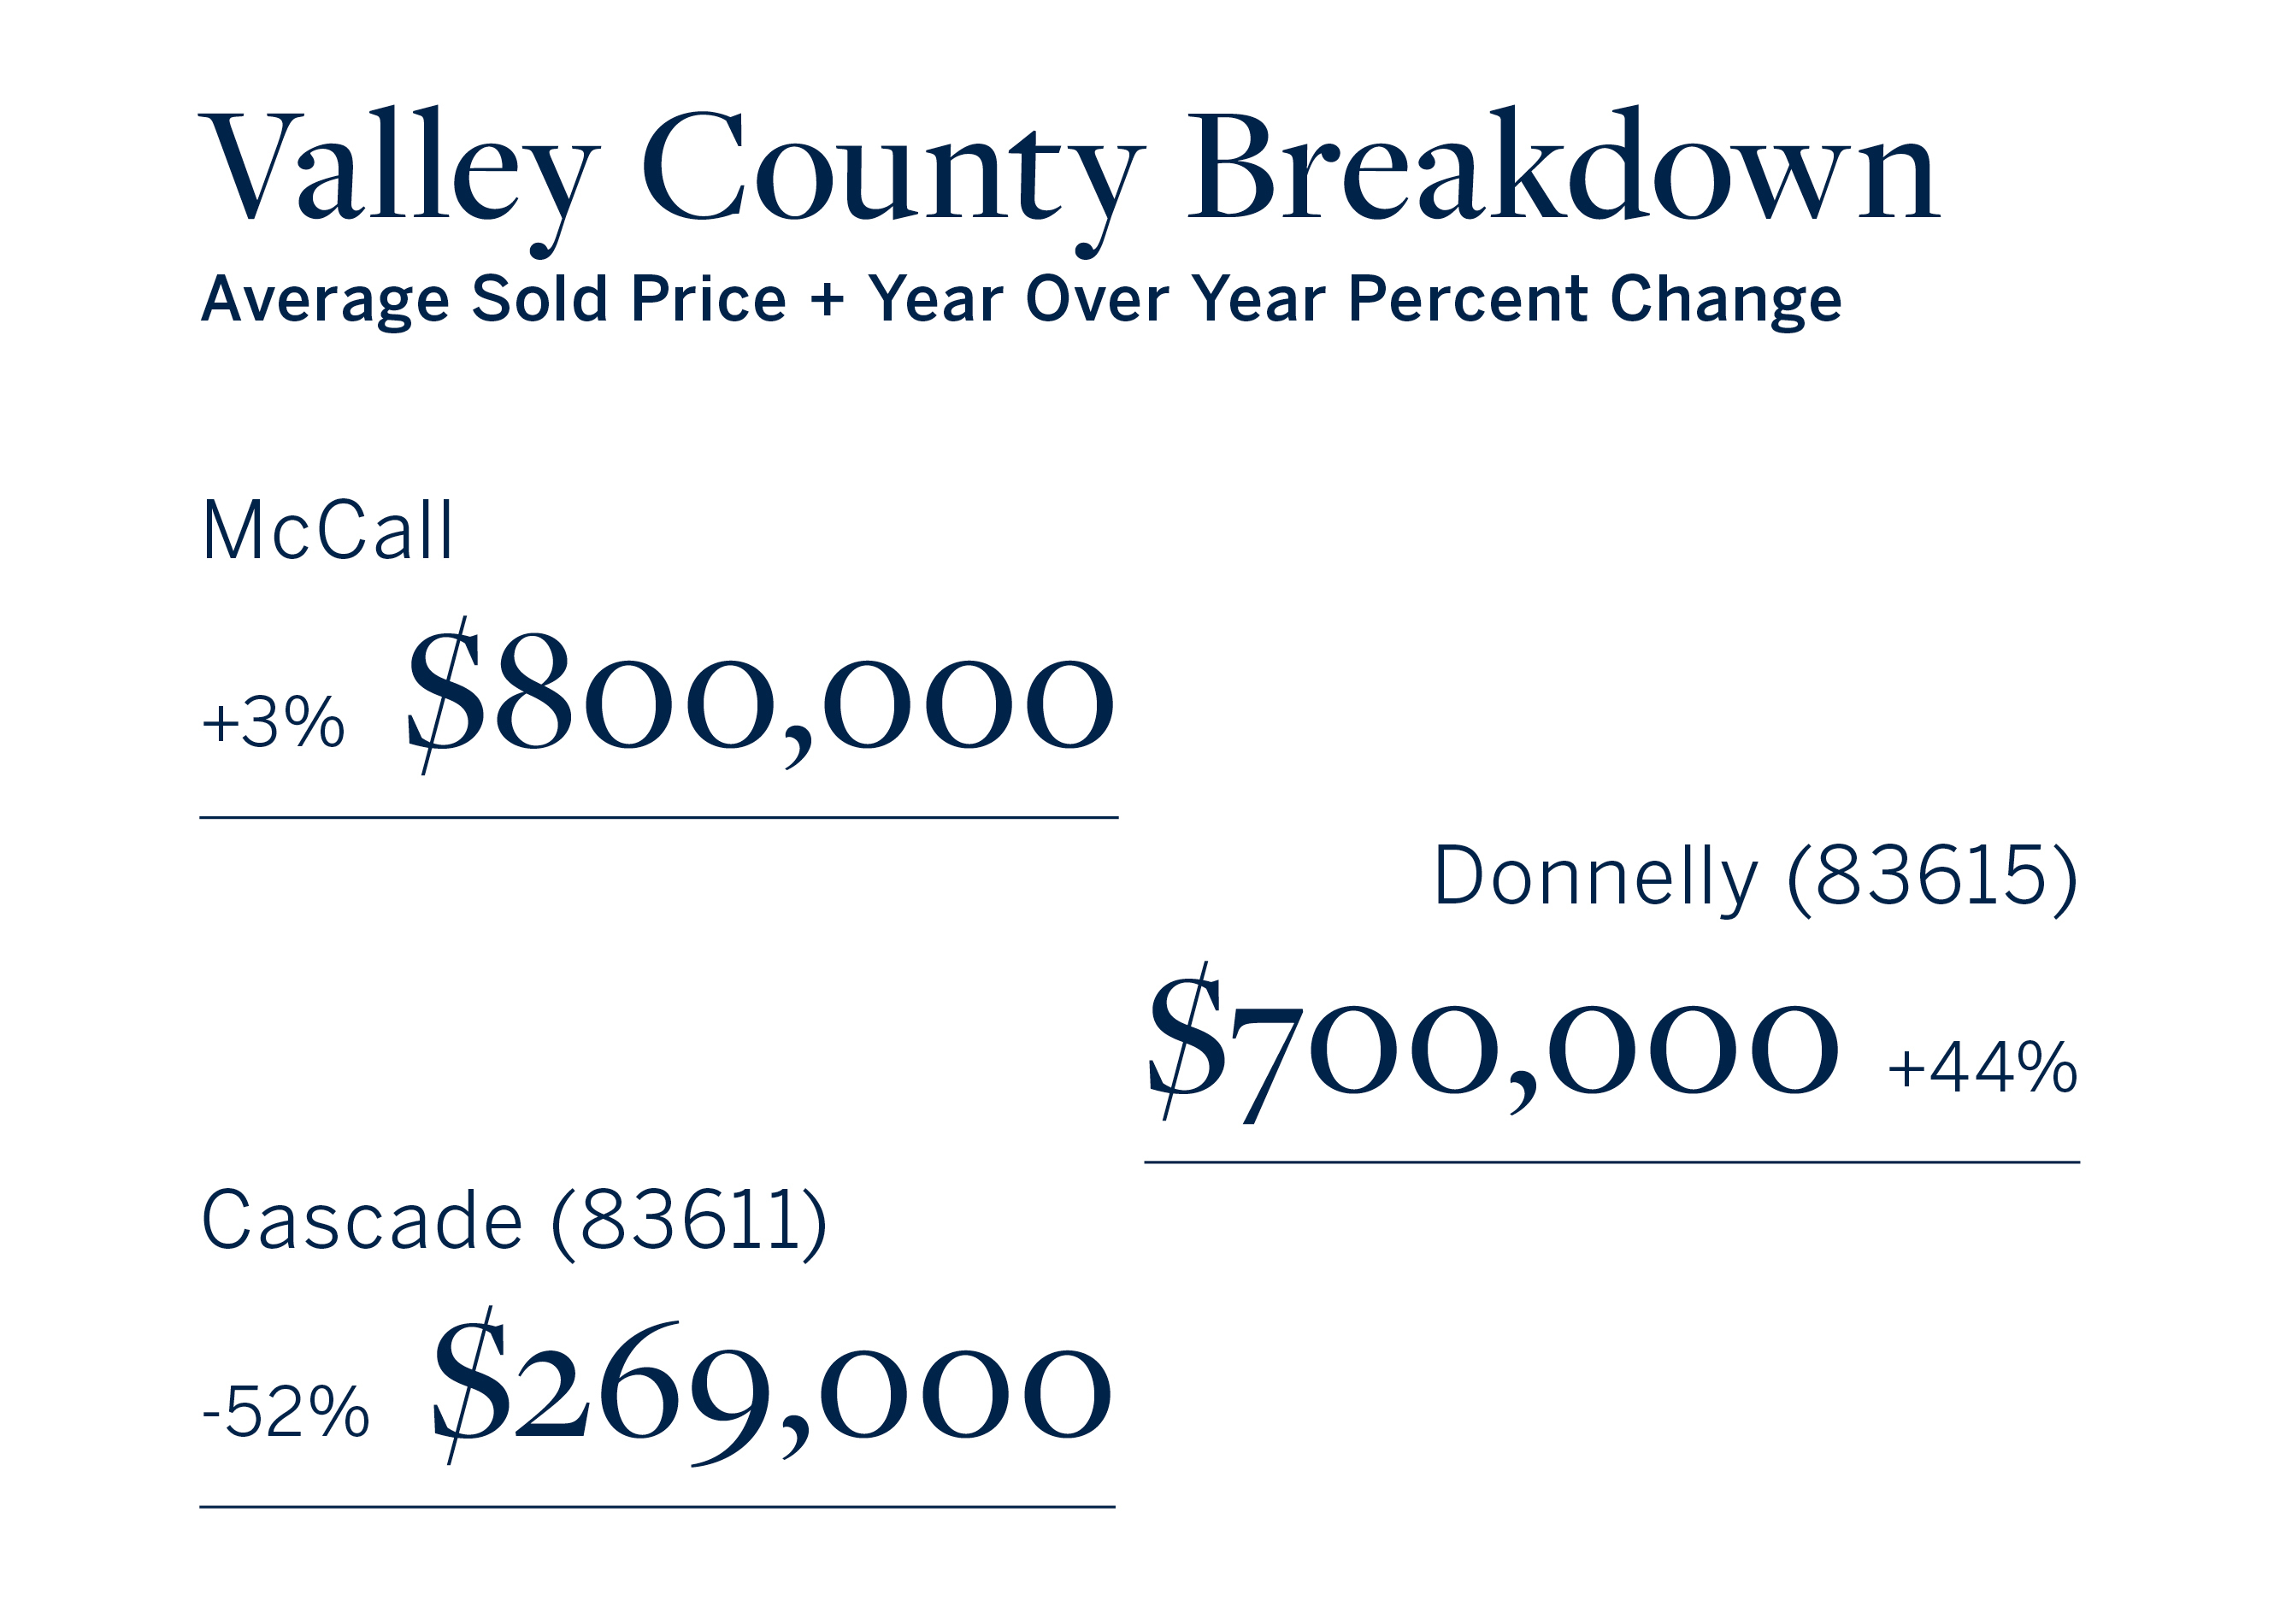
Each month, I provide a real estate market report featuring key numbers, including average home prices, year-over-year price changes, total number of homes sold, average days on market, and the change in days on market compared to the previous year.
Understanding these numbers will give you a clear view of what’s happening in the Ada and Canyon County markets, and help you make informed decisions, whether you’re buying or selling.
Average home prices show us the current value of homes in the area. If prices are rising, it’s a sign of strong demand, meaning sellers have an advantage. If prices are stable or falling, buyers may have more room to negotiate.
The total number of sales each month indicates market activity. More sales typically mean there’s strong demand, while fewer sales could mean buyers are cautious or there’s limited inventory available.
The average days on market measures how long homes take to sell. Lower days on market show homes are selling quickly and the market favors sellers. Higher days on market means homes are taking longer to sell, giving buyers more choices and leverage.
Finally, the year-over-year change in average days on market shows if the market is speeding up or slowing down compared to last year. Faster sales indicate a competitive market, while slower sales point toward a more balanced or buyer-friendly environment.
Use this information to help guide your real estate decisions and better understand current market trends.

